Originally published at: SCW Q&A: Loopy radar, conflicting forecasts, rising houmidity, weather stations, sudden storms – Space City Weather
This installment of the Space City Q&A is particularly tasty: Y’all came up with some very good questions! Keep them coming: Hit the Contact link at the top of the blog, or leave a query in the Discourse comments below this post.
Q. I have a question as to how weather radars generate their one-hour plus future radar loop. Some recent rain showers have been from storms that kind of pop up on the radar, meander around for a bit and then dissipate. They usually don’t have an easily defined direction to them like they might have if they were spawned from a frontal boundary moving in. However, on most radar loops that I watched, as the radar passes from the older, real radar data to the projected data, the storms go from wandering with no direction to a well defined direction. In reality, as time moves forward the storms end up meandering and don’t go in the predicted direction. Any thoughts as to why this occurs?
A. I am not an expert in predictive radar apps, but I have done some research in this area in the past. So I’m going to dive in a little bit here because I think it’s a good question.
First of all, as you’ve suggested, these predictive apps work best when there are clearly defined storm motions, such as along a frontal boundary. This is because the “nowcast” for 0 to 60 minutes is based on current radar readings and inferred motion vectors based on storm intensity, speed, and direction. More sophisticated methods might also incorporate flow equations, such as the Lucas–Kanade method. (Dear reader, it has been 30 years since I took an advanced mathematics class, and I’m not going to try and explain how that works. Because I really don’t know.) These forecasts are quite accurate for storms with clearly defined motions, but less so for other storms. I would trust them for about 30 to 60 minutes out, at most.
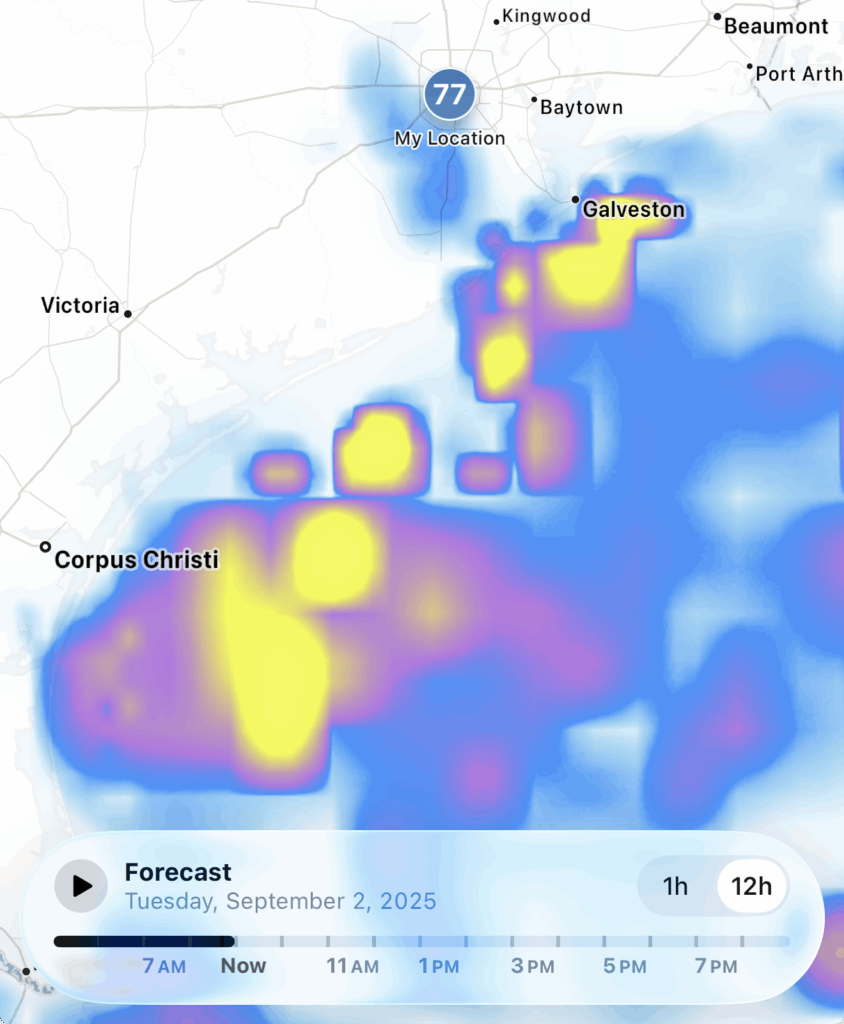
Then there are medium-term forecasts that run from 1 hour out to several hours. These generally rely on a single high-resolution model, such as the High-Resolution Rapid Refresh (HRRR), or a blend of models with some AI-enhancement thrown in. Again, for something like a line of storms ahead of a frontal passage, these can be pretty accurate. But if storms are just popping up around the city during the afternoon, they’re probably not going to reliably tell you if it is going to rain at your house three hours from now. I mean, sure, they’ll get lucky some time. But they’re also going to miss. I wouldn’t trust any predictive radar app more than a couple of hours out.
–Eric
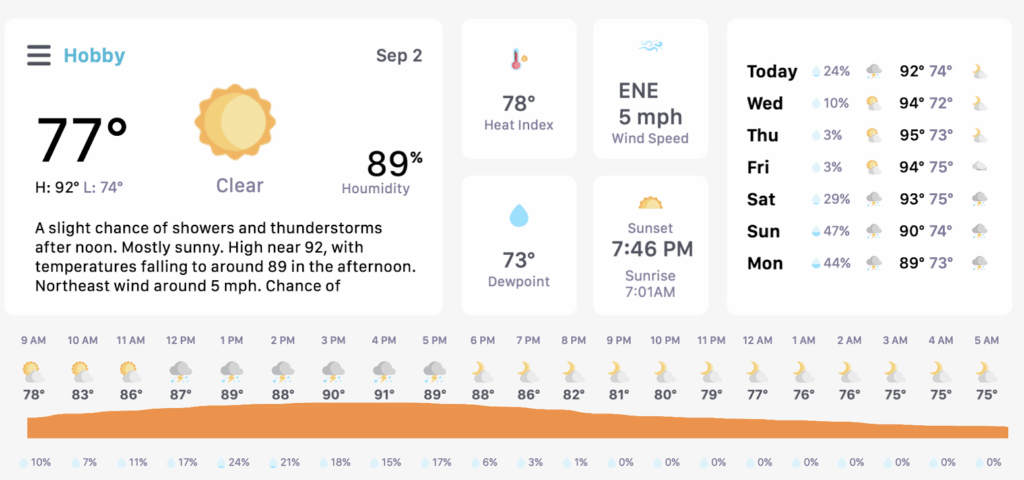
Q. It’s not new, but it feels more noticeable lately with the new weather reporter at the Houston Chronicle. I usually read him, check your forecast, and glance at the iPhone app. A recent day offered a good example: he predicted highs in the upper 90s, possibly hitting 100. My iPhone said 89. You (correctly) called for mid-to-upper 90s. How can one source call for 100 while another is calling for 89? I guess it feels like the spread is getting wider, not narrower. I’d expect the opposite with improved technology. I assume it comes down to different models, how showers affect afternoon highs, and maybe even some editorial choices (the Chronicle does seem to lean into more dramatic weather headlines recently).
A. I can’t speak for the Chronicle’s forecasts, but I know Justin Ballard tries to do a good job. And if there are sensationalistic headlines, they’re generally coming from online editors pressured to drive up traffic numbers rather than the forecaster. I dealt with this when I worked for the newspaper, which is one reason why I very much prefer working for myself.
Anyway, I suspect it may be a combination of things. When I say the highs in Houston are likely to be the mid- to upper-90s, I’m referring to the central portion of the area, i.e. Harris County. Daytime temperatures in the summer will invariably be cooler in Galveston, near the water, and often warmer further inland, such as in Conroe or Sealy. Perhaps Justin was referring to the forecast at Bush Intercontinental Airport, and I was more considering Hobby. That would explain the variance in our forecast.
As to why the iPhone said 89 degrees, perhaps it was forecasting an afternoon shower to keep things cooler? I don’t really know. But in general, a lot of the variety in temperature forecasts for Houston are due to its large area (more than 90 miles from Galveston to Conroe), varied nature of the terrain, urban heat island effect for the city’s core, and surface temperatures of the Gulf of Mexico. It’s … a lot to balance.
–Eric
Q: As far as climate change goes, rising global temperatures get a lot of attention, I was wondering if global humidity levels are trending upward, too? This year may be more an extreme example, but I was wondering: As the temperature rises, and more water evaporates from the oceans and other bodies of water, giving precipitation events “more to work with.” i.e. Has there been a noticeable shift upward in global average humidity levels?
A. When you think about humidity here in Houston – or “houmidity,” as we sometimes call it – you (should) think about dewpoint. Dewpoint is a measure of moisture in the air; it’s the temperature that the air would need to cool to for it to be saturated. When dewpoints are high, it feels very humid, hence why Houston’s summers are so generally awful; we have dewpoints often in the mid-70s to even upper-70s at times. Periodically, the immediate Gulf Coast can see dewpoints of 80°, and there have been instances of some places in the Middle East (Iran in particular) seeing dewpoints over 90°!
Why does it feel so humid? Warmer air holds more moisture. You could have a relative humidity of 100% with a temperature of 50° and a dewpoint of 50°. That feels damp or clammy, but it isn’t oppressive. But if you have a dewpoint of 75° and an air temperature of 75°, that feels disgusting. The relative humidity is 100% in that case too. But because the air temperature is warmer, it’s holding more moisture.
Thus, as climate change continues, we will see global humidity levels increasing too. A warmer planet has more capacity to hold moisture, so generally the humidity and dewpoints will be higher. You can read more from the UK Met Office here. Thinking about this locally, 2025 sure seemed like a fairly mild summer by almost anyone’s standards in Houston. But it was the 6th warmest on record because our nighttime lows were second highest on record. Put simply, the daytimes weren’t so bad, but the nighttimes were persistently very warm, even by Houston standards. Some of that is certainly urban heat island affect (more concrete = warmer nights). But it doesn’t explain why Bush, College Station, Galveston, and Hobby have all had top 20 or 30 hot summers every summer since 2016 (with the exception of 2017 in Galveston). That is likely because the atmosphere is warming, the Gulf is warming, and it’s able to hold more moisture and keep nighttimes much warmer than usual.
–Matt
Q: Are the CenterPoint Energy weather stations available to the public? If so, how do I locate and see the one near me?
A. Yes they are!
All the data from the sensors is being pushed out publicly through a company called “Synoptic,” which acts as a data source for various sources of weather observation data. The data can be accessed through a NOAA website (that’s a fantastic resource beyond just CNP weather stations). Within the Weather & Hazards data viewer, you’ll be presented with a buffet of sites you can choose from. These are not just CenterPoint weather sensors, but they include everything from Harris County Flood Control to Union Pacific Railroad to major airport sensors like at Bush and Hobby. You’ll have to click around a bit to find a CenterPoint one, but it’ll be a number 1-100, a location name, and then a suffix of CE. You can toggle the variable you want to see, including wind gusts, dewpoint, or rainfall, among others. There’s even a historical data mode on this site if you want to see observations from a particular date and time. It’s just a great site to bookmark!
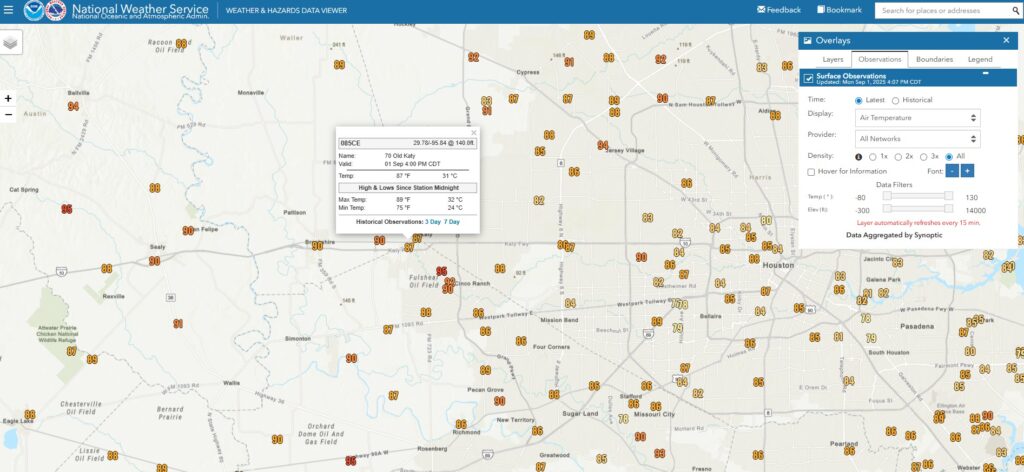
There are also links to 3 day and 7 day histories as well. Those can be bookmarked for real time access updated every 10 minutes (such as this one for Sugar Land), and I would encourage you to bookmark the ones from any source closest to your house!
–Matt
Q: I live in Tomball off Texas 249/99 and we have had some intense storms Monday evening and Tuesday morning. It got so bad Monday evening that I got my family in the bathroom as winds had to be 40-50mph and were getting quarter size hail. The same thing happened this morning to where the wind was so intense that we had trees down in our neighborhood. I looked on my radar app and at the time, there was not even a Special weather statement. Later on they did issue it after it had passed through. I have seen storms that were severe warned that were much less intense. How a storm can be that intense and the NWS didn’t have any warning on it?
A: I’ll give you a good example of this. I am assuming that your experience was during the storms we had near the end of August. One of them produced a 66 mph wind gust at Brazos Bend State Park (from a CenterPoint sensor actually!) at 5:10 PM on August 21st.
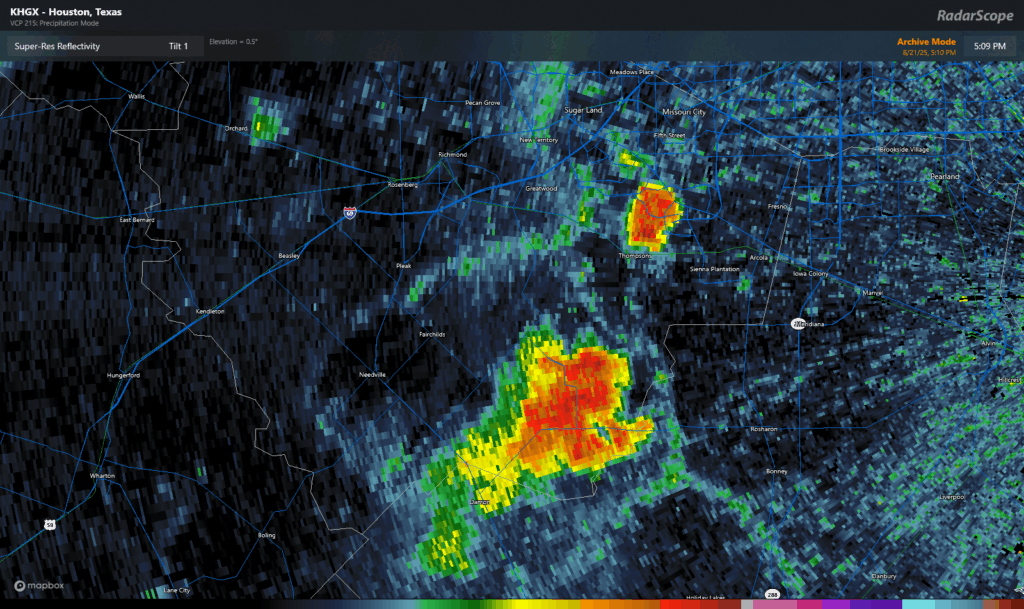
Looking at radar, I’m not especially close to issuing a warning on that storm based on what we see above. One issue with Houston is that we are such a sprawling city that we actually have some pretty healthy data gaps when storms push through the area. Radar is critical, but it is also imperfect sometimes. Even the higher resolution and slightly closer Hobby Terminal Dopper Weather Radar showed winds of only about 35 mph in the above example. No indication whatsoever that this storm is producing 60 to 70 mph winds, but it is.
So there are instances where storms can (literally) fly under the radar. The radar beam up your way is shooting up to around 3,500-4,000 feet above the surface. So there is a chance that in those cases it was missing what was occurring closer to the ground.
It’s also not granular in time, either. Periodically, something will happen with a storm where it does its dirty work over the course of a minute or two, and it could happen in between the 2 to 4 minute radar scans we often get. Also, storms here tend are often what we call “pulse” storms: They ramp up quickly and ramp down just as quickly. You can literally go from a shower to a 50 mph hail-producing storm in the course of minutes. If I am correctly recalling the day you’re discussing, those storms were in fact remarkably quick to rev up. NWS did issue warnings, but there was a bit of playing from behind going on because of the nature of those types of storms.
But the reality is that until we get to more substantial radar coverage at more granularity than we’re currently capable of right now, there will occasionally be a miss like this from time to time. It’s the nature of uncertainty. It’s also a good reminder that if you see something, report it! Send it to us, the NWS, or your favorite local meteorologist. We’ll try to make sure it gets to the right people.
–Matt